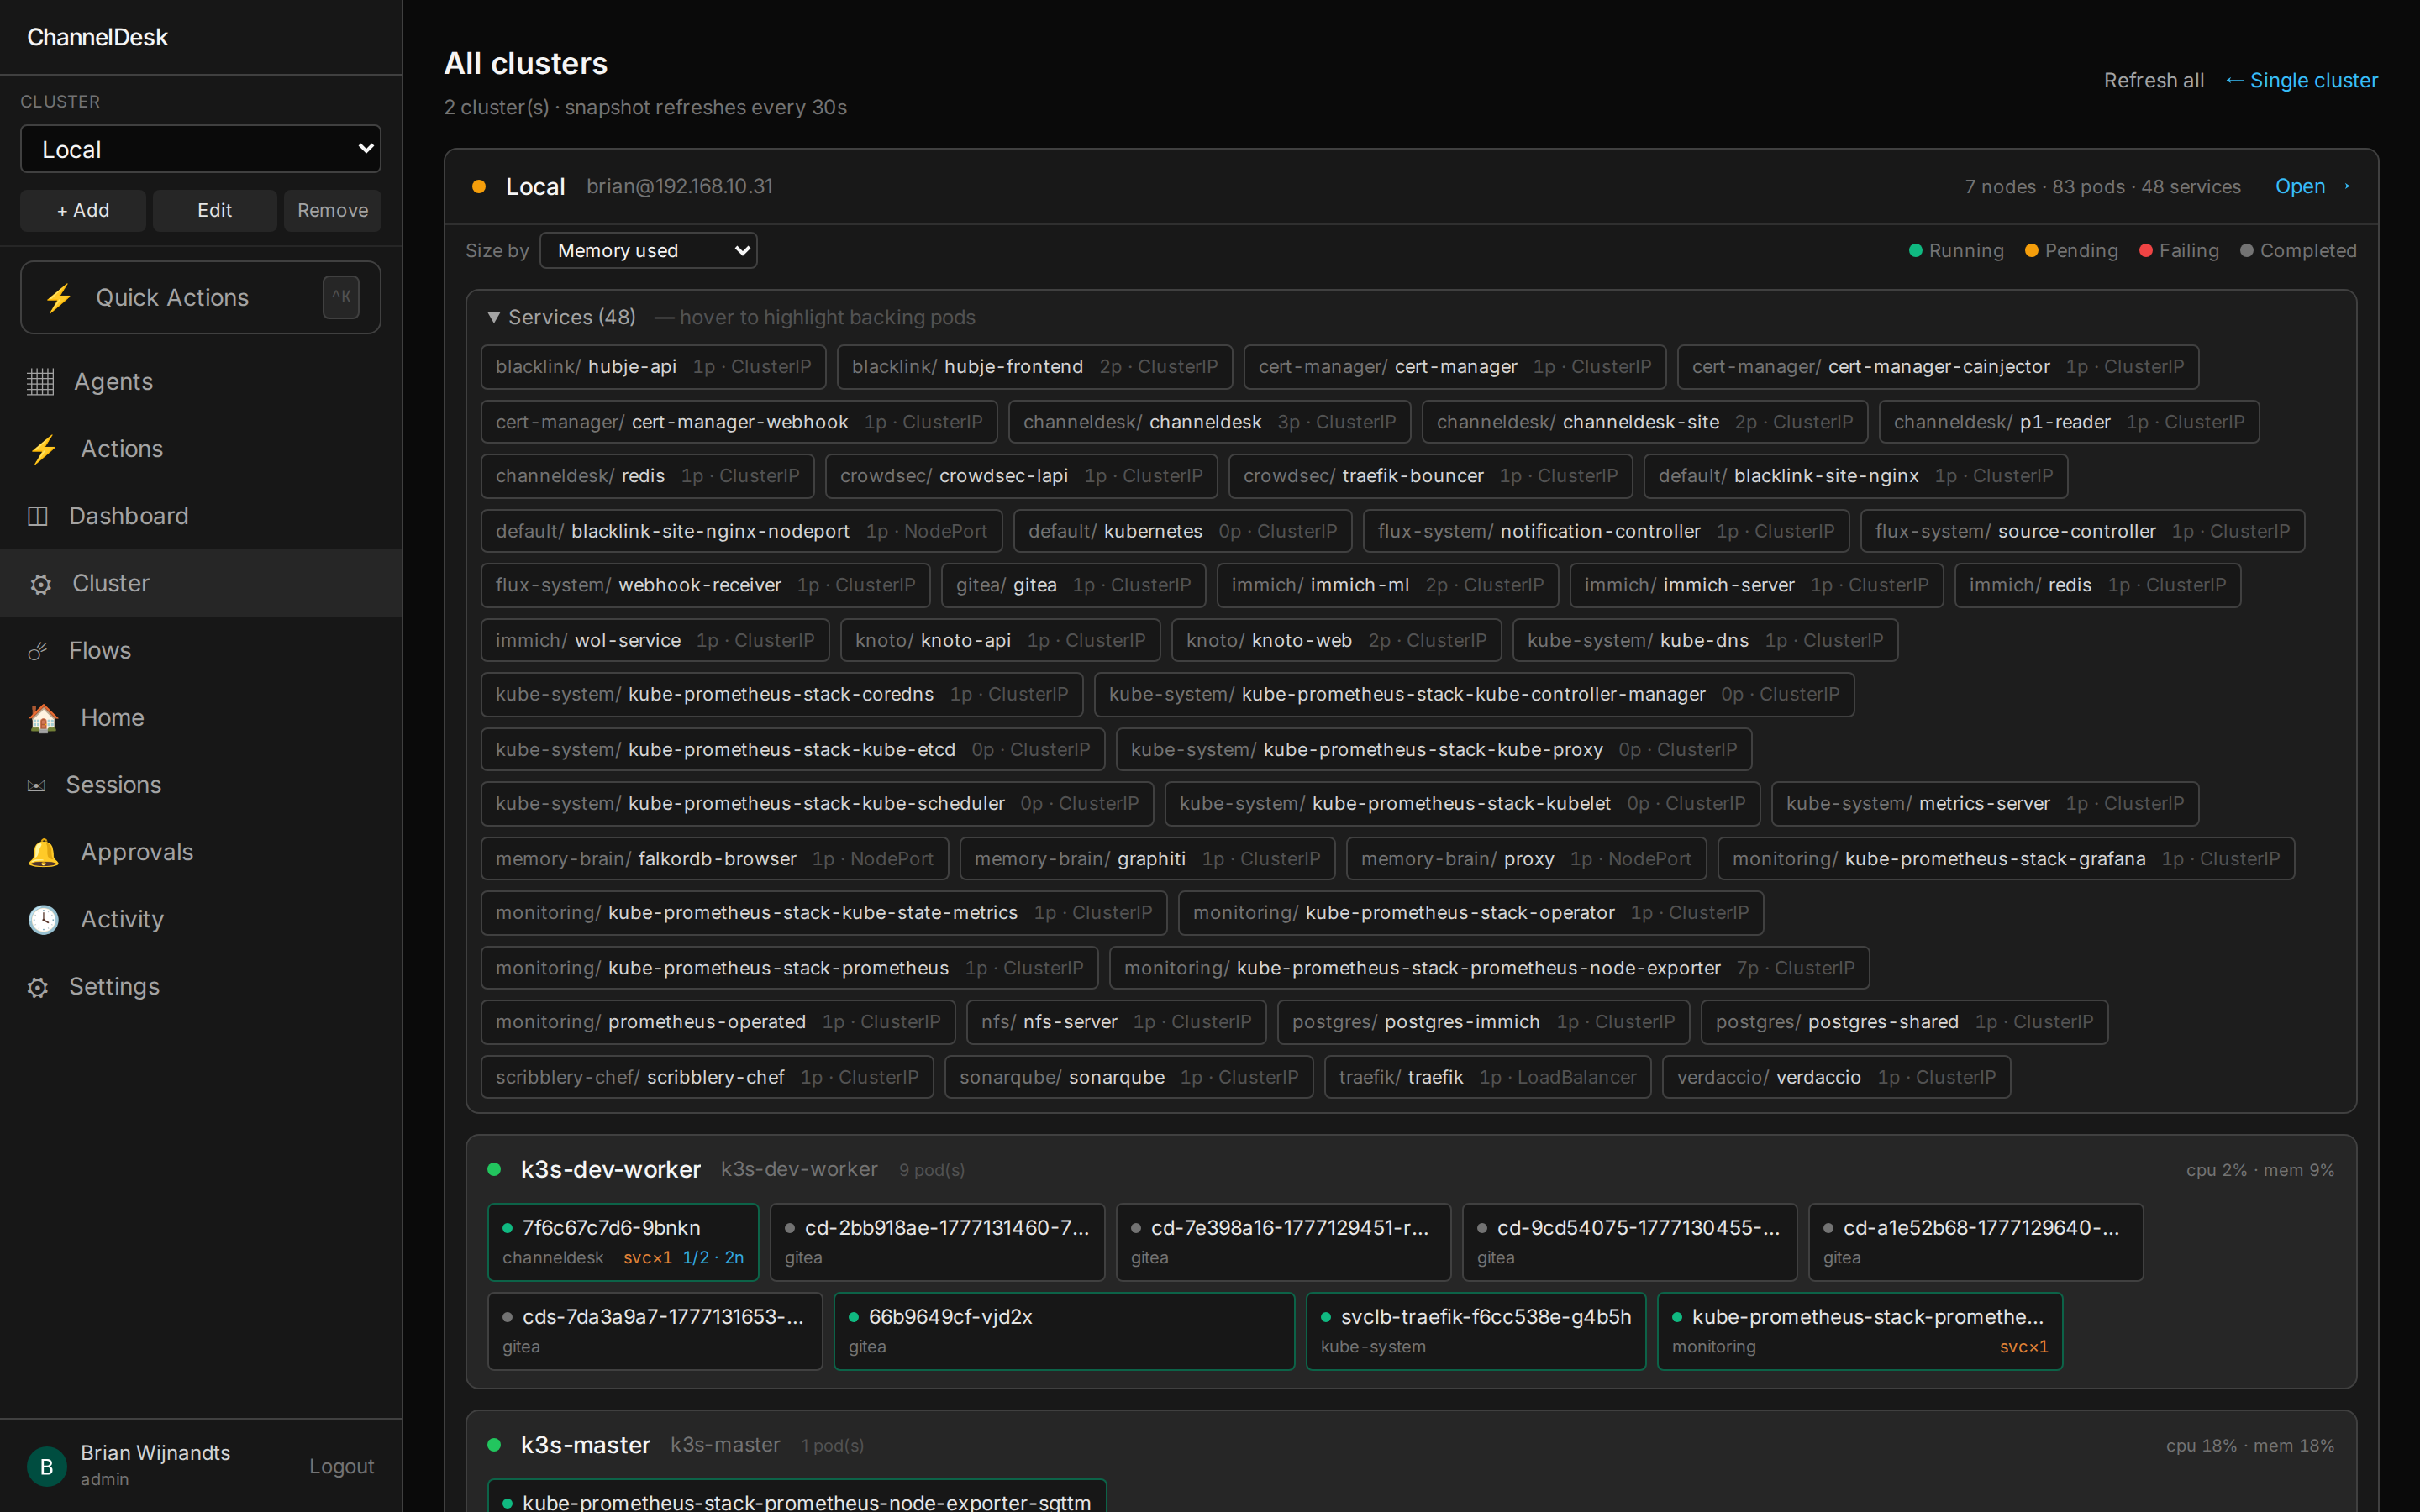
Your cluster, on one page.
/cluster shows everything that matters about your k3s in one scroll —
health, problems, events, nodes, pods, logs — and lets you click "Investigate →"
on anything that's red to spawn a Claude session pre-seeded with the row's context.
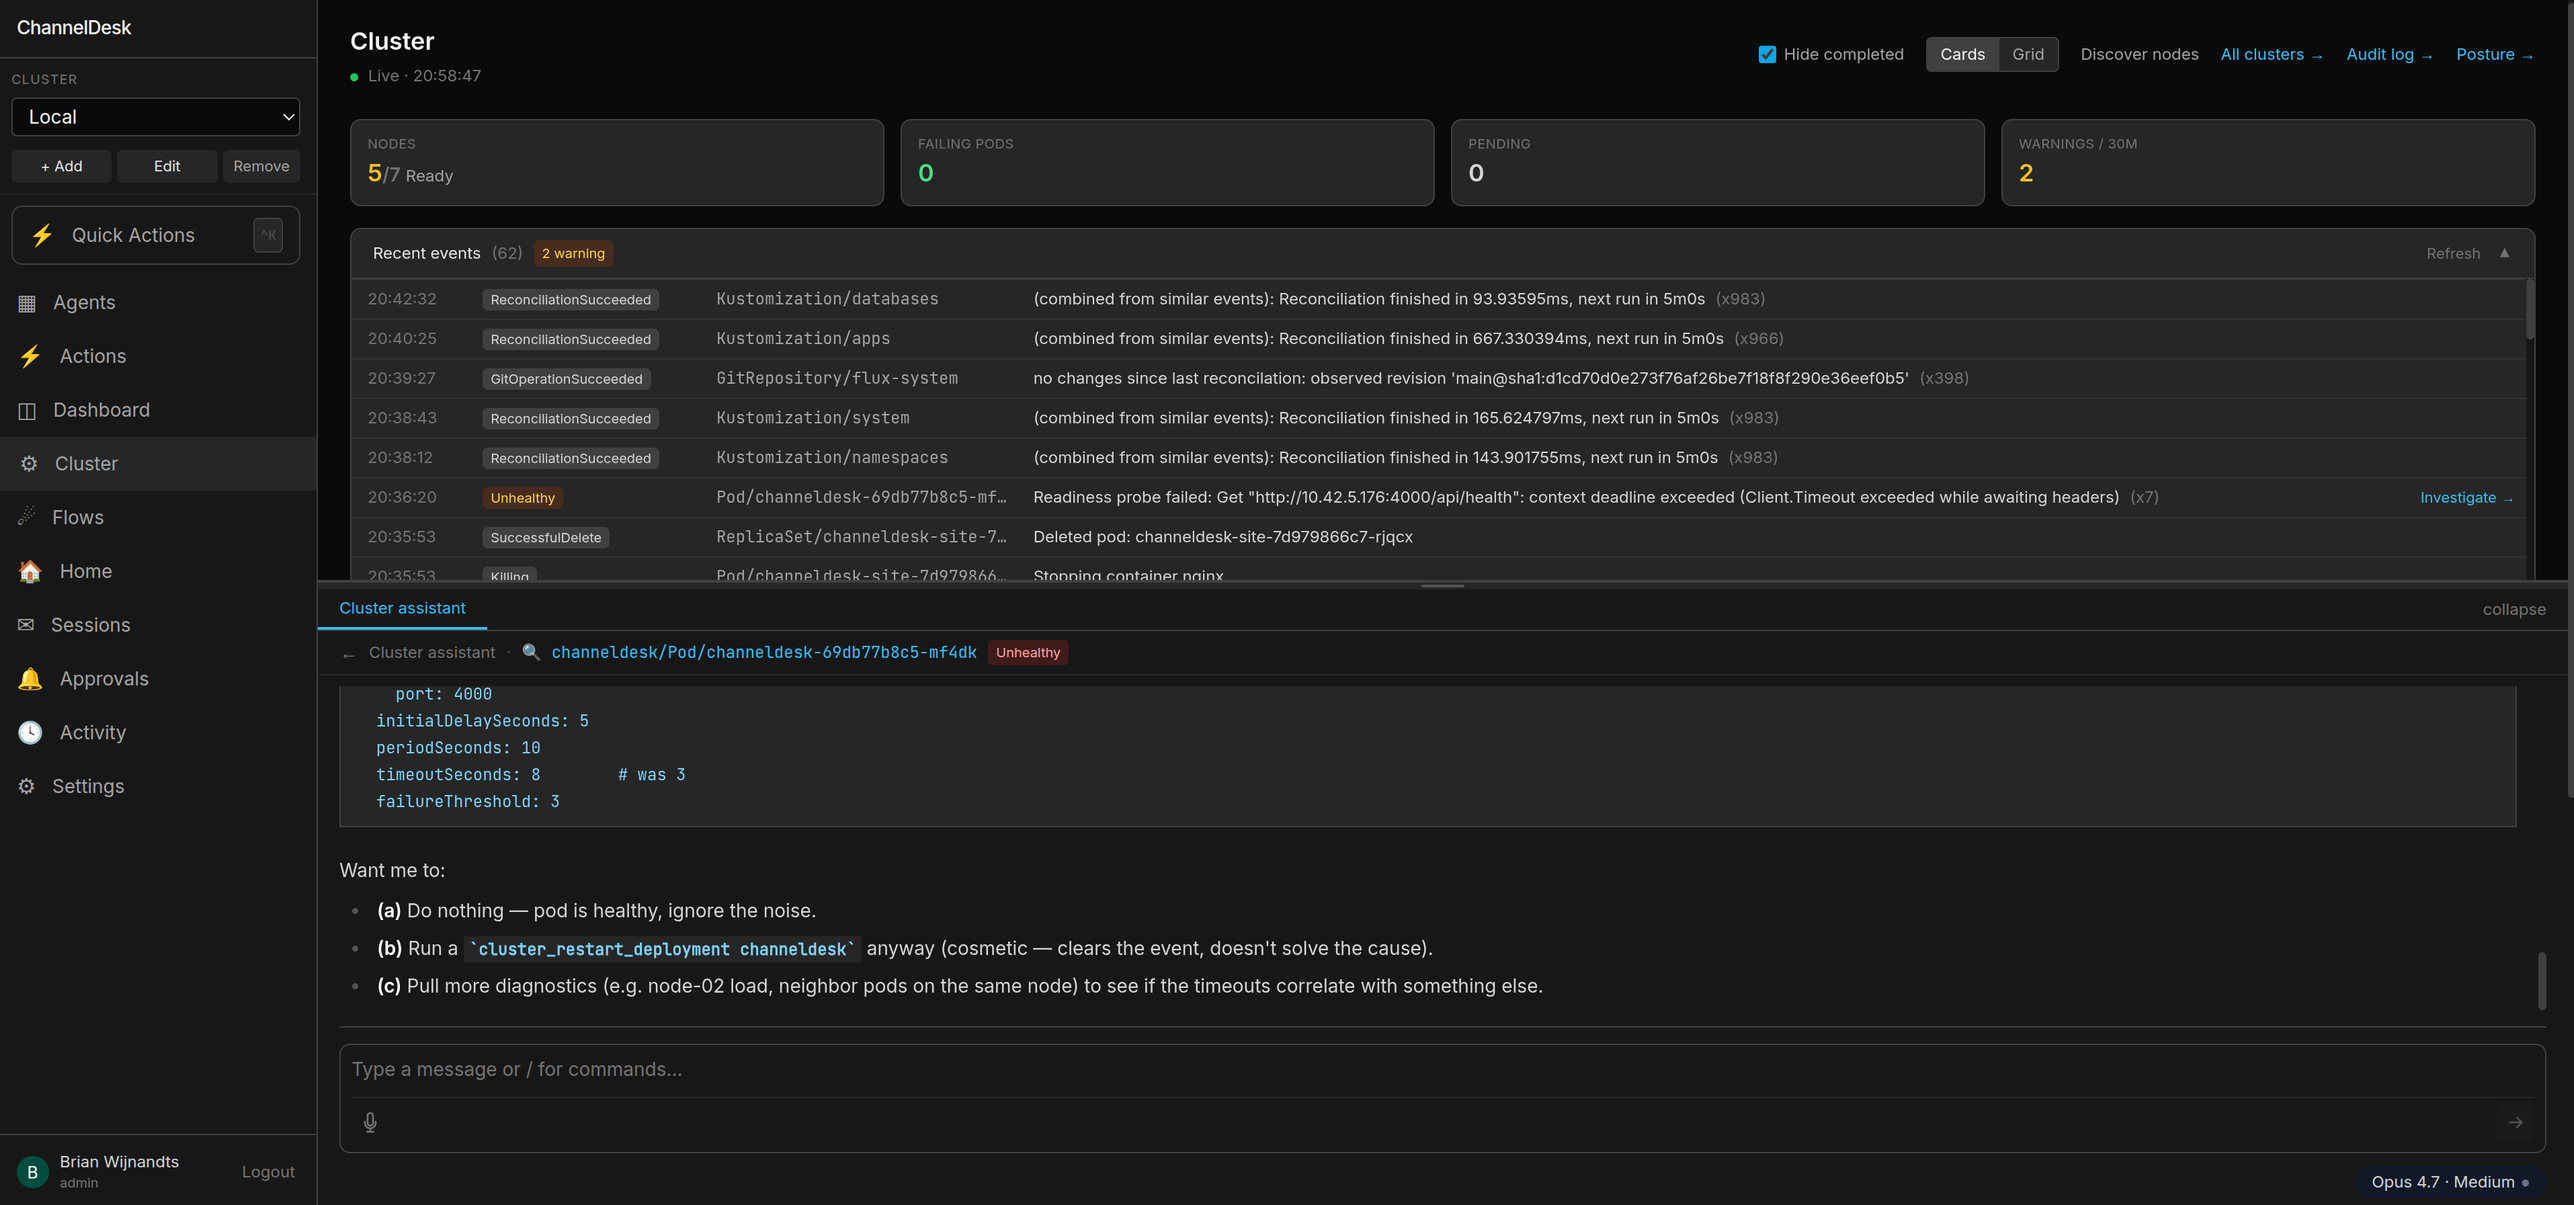
Health banner
Problems pane
pod.reason or the most
recent matching Warning event.
Events feed
Node cards
Pod logs side-panel
tail --500) plus optional 2 s polling for follow mode.
Case-insensitive filter, copy, download.
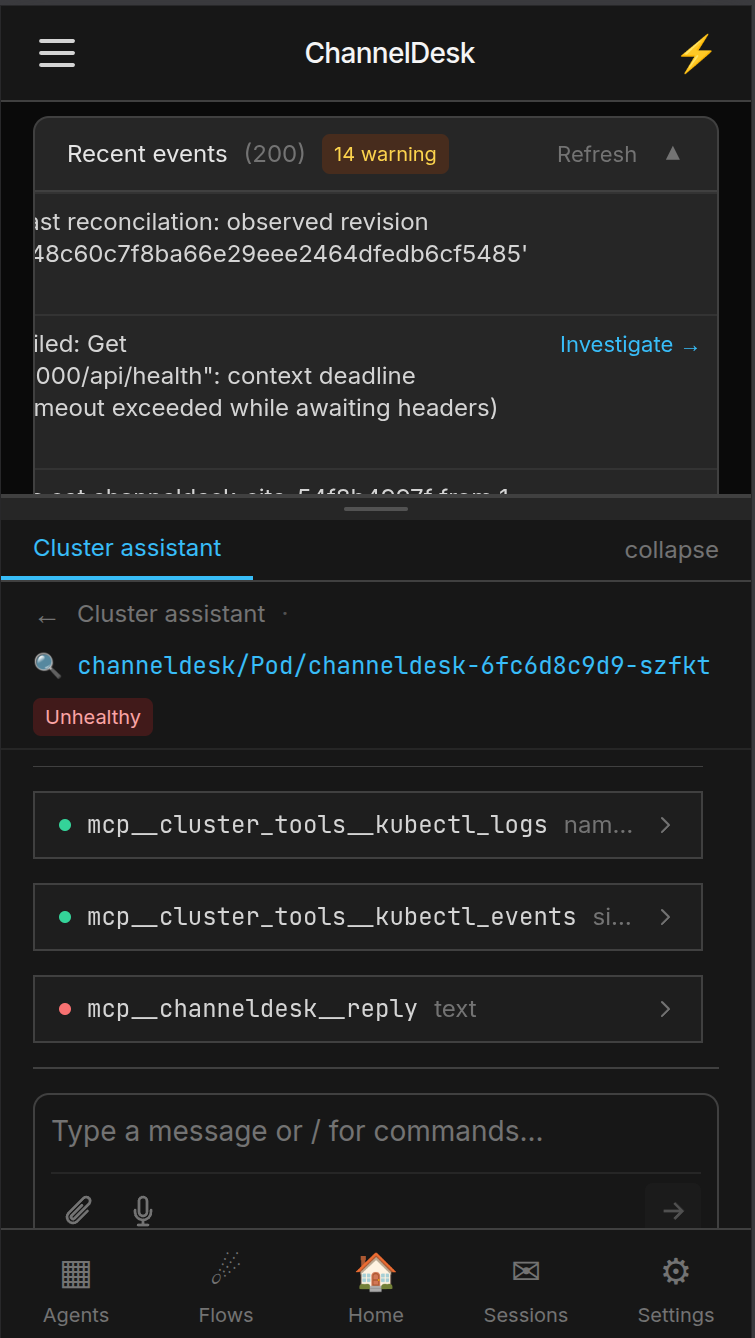
Cluster assistant chat dock
kubectl_get, kubectl_logs, kubectl_events as read tools;
cordon / drain / scale / restart / delete-pod as write tools, each gated by an
Allow / Deny approval prompt.
One click. Focused session. Pre-seeded with the problem.
Every problem row and Warning event has an Investigate → button. Clicking it spawns a fresh Claude session with that row's context already loaded into the system prompt — pod name, namespace, reason, the lot. The agent starts already knowing what it's looking at.
channeldesk-orchestrator-7f9 is CrashLoopBackOff on worker-02. Why?
kubectl_logs + kubectl_events. /var/log on worker-02 is at 91 % — Postgres can't checkpoint, orchestrator can't reach it, kubelet kills the pod. Fix: cordon worker-02, drain to worker-01, vacuum journald. Cordon worker-02 now? Default rolling session lives in the dock between visits. Investigate spawns a side-by-side focused session marked with a 🔍 icon and the pod / event label, so you can compare what the rolling chat thinks against a fresh take.
22 checks. Five categories. One score.
/cluster/posture runs an on-demand security audit against your master
and every worker. It renders an overall score, per-category tiles, and the full
check list with evidence + a one-line remediation hint for every failure.
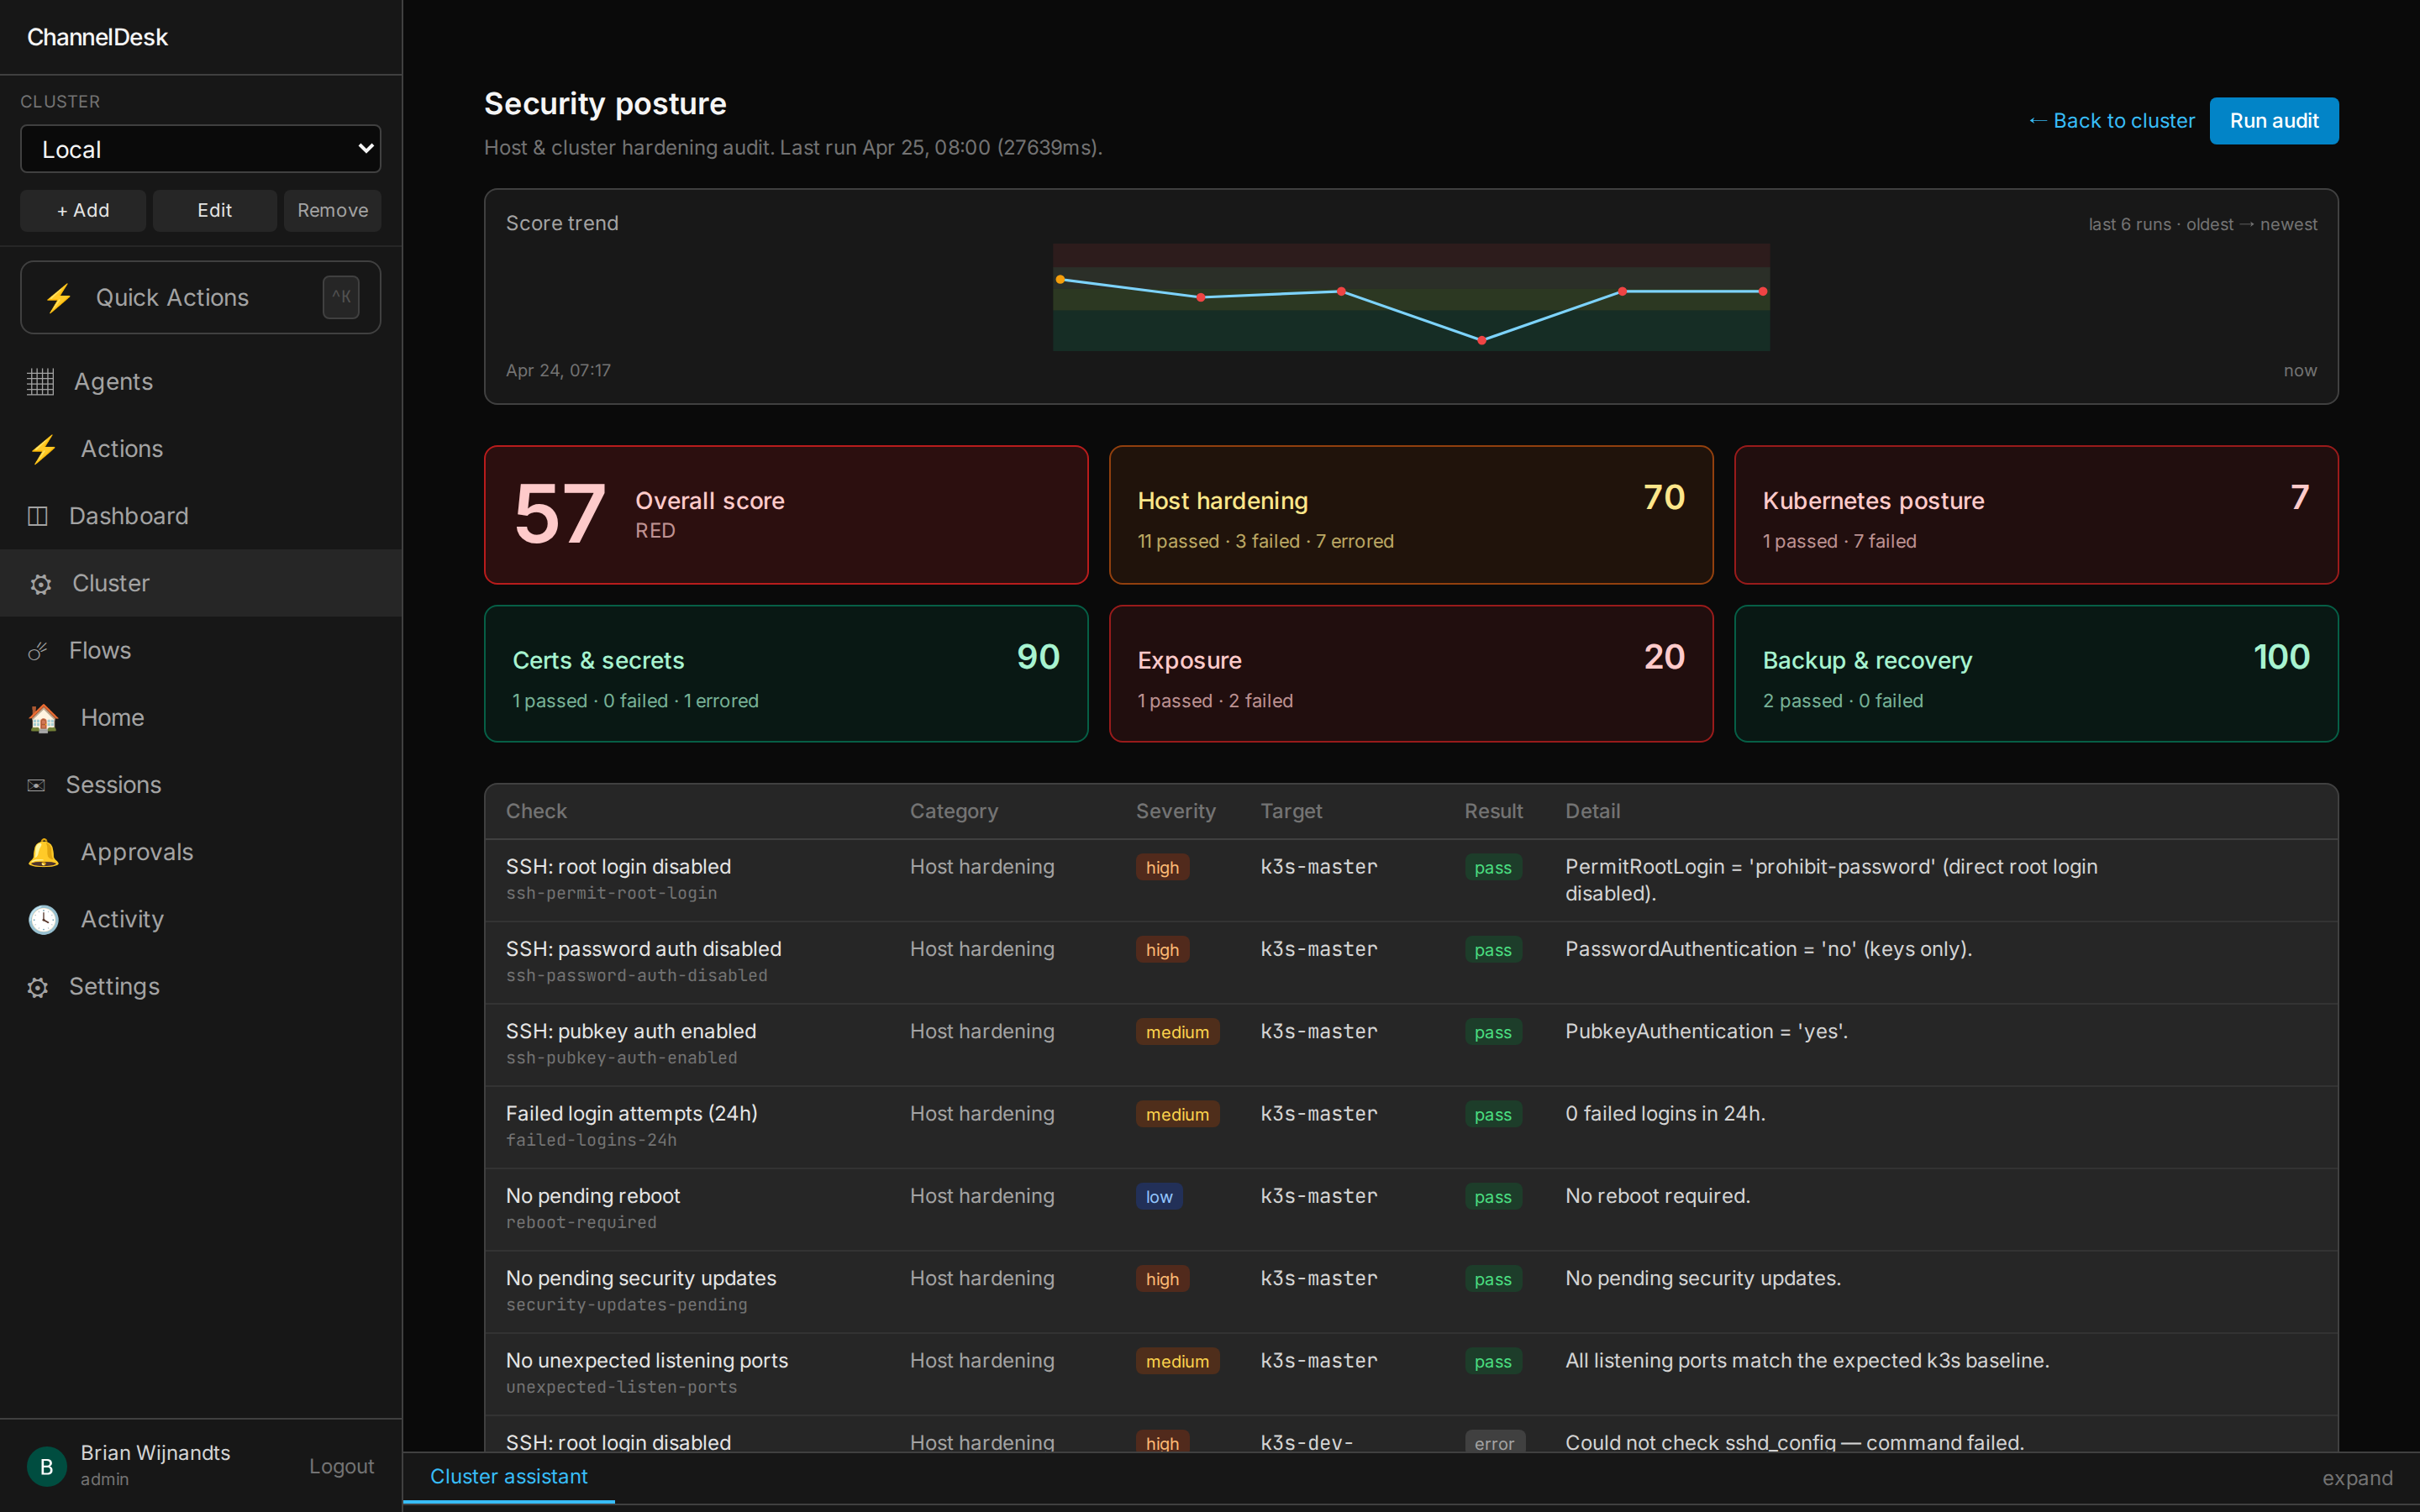
Host hardening
Kubernetes
Exposure
Certs & secrets
Backup & recovery
Failure → Investigate
Fix it. With your approval.
Most posture tools stop at "your sshd config is wrong". ChannelDesk has three armed MCP fixers that will actually edit the file, run the upgrade, or reboot the host — but only after you click Allow in the chat, and only when the per-tool safety guard is satisfied.
- ●
posture_fix_sshd_directive— edit a single sshd directive. Master gets an extra orchestrator-auth-safety guard so we never lock ourselves out. - ●
posture_apt_upgrade_security— apply security upgrades only, no fulldist-upgraderoulette. - ●
posture_reboot_host— etcd-snapshot freshness preflight + 15-min master delay floor so a multi-node reboot can't take the cluster with it.
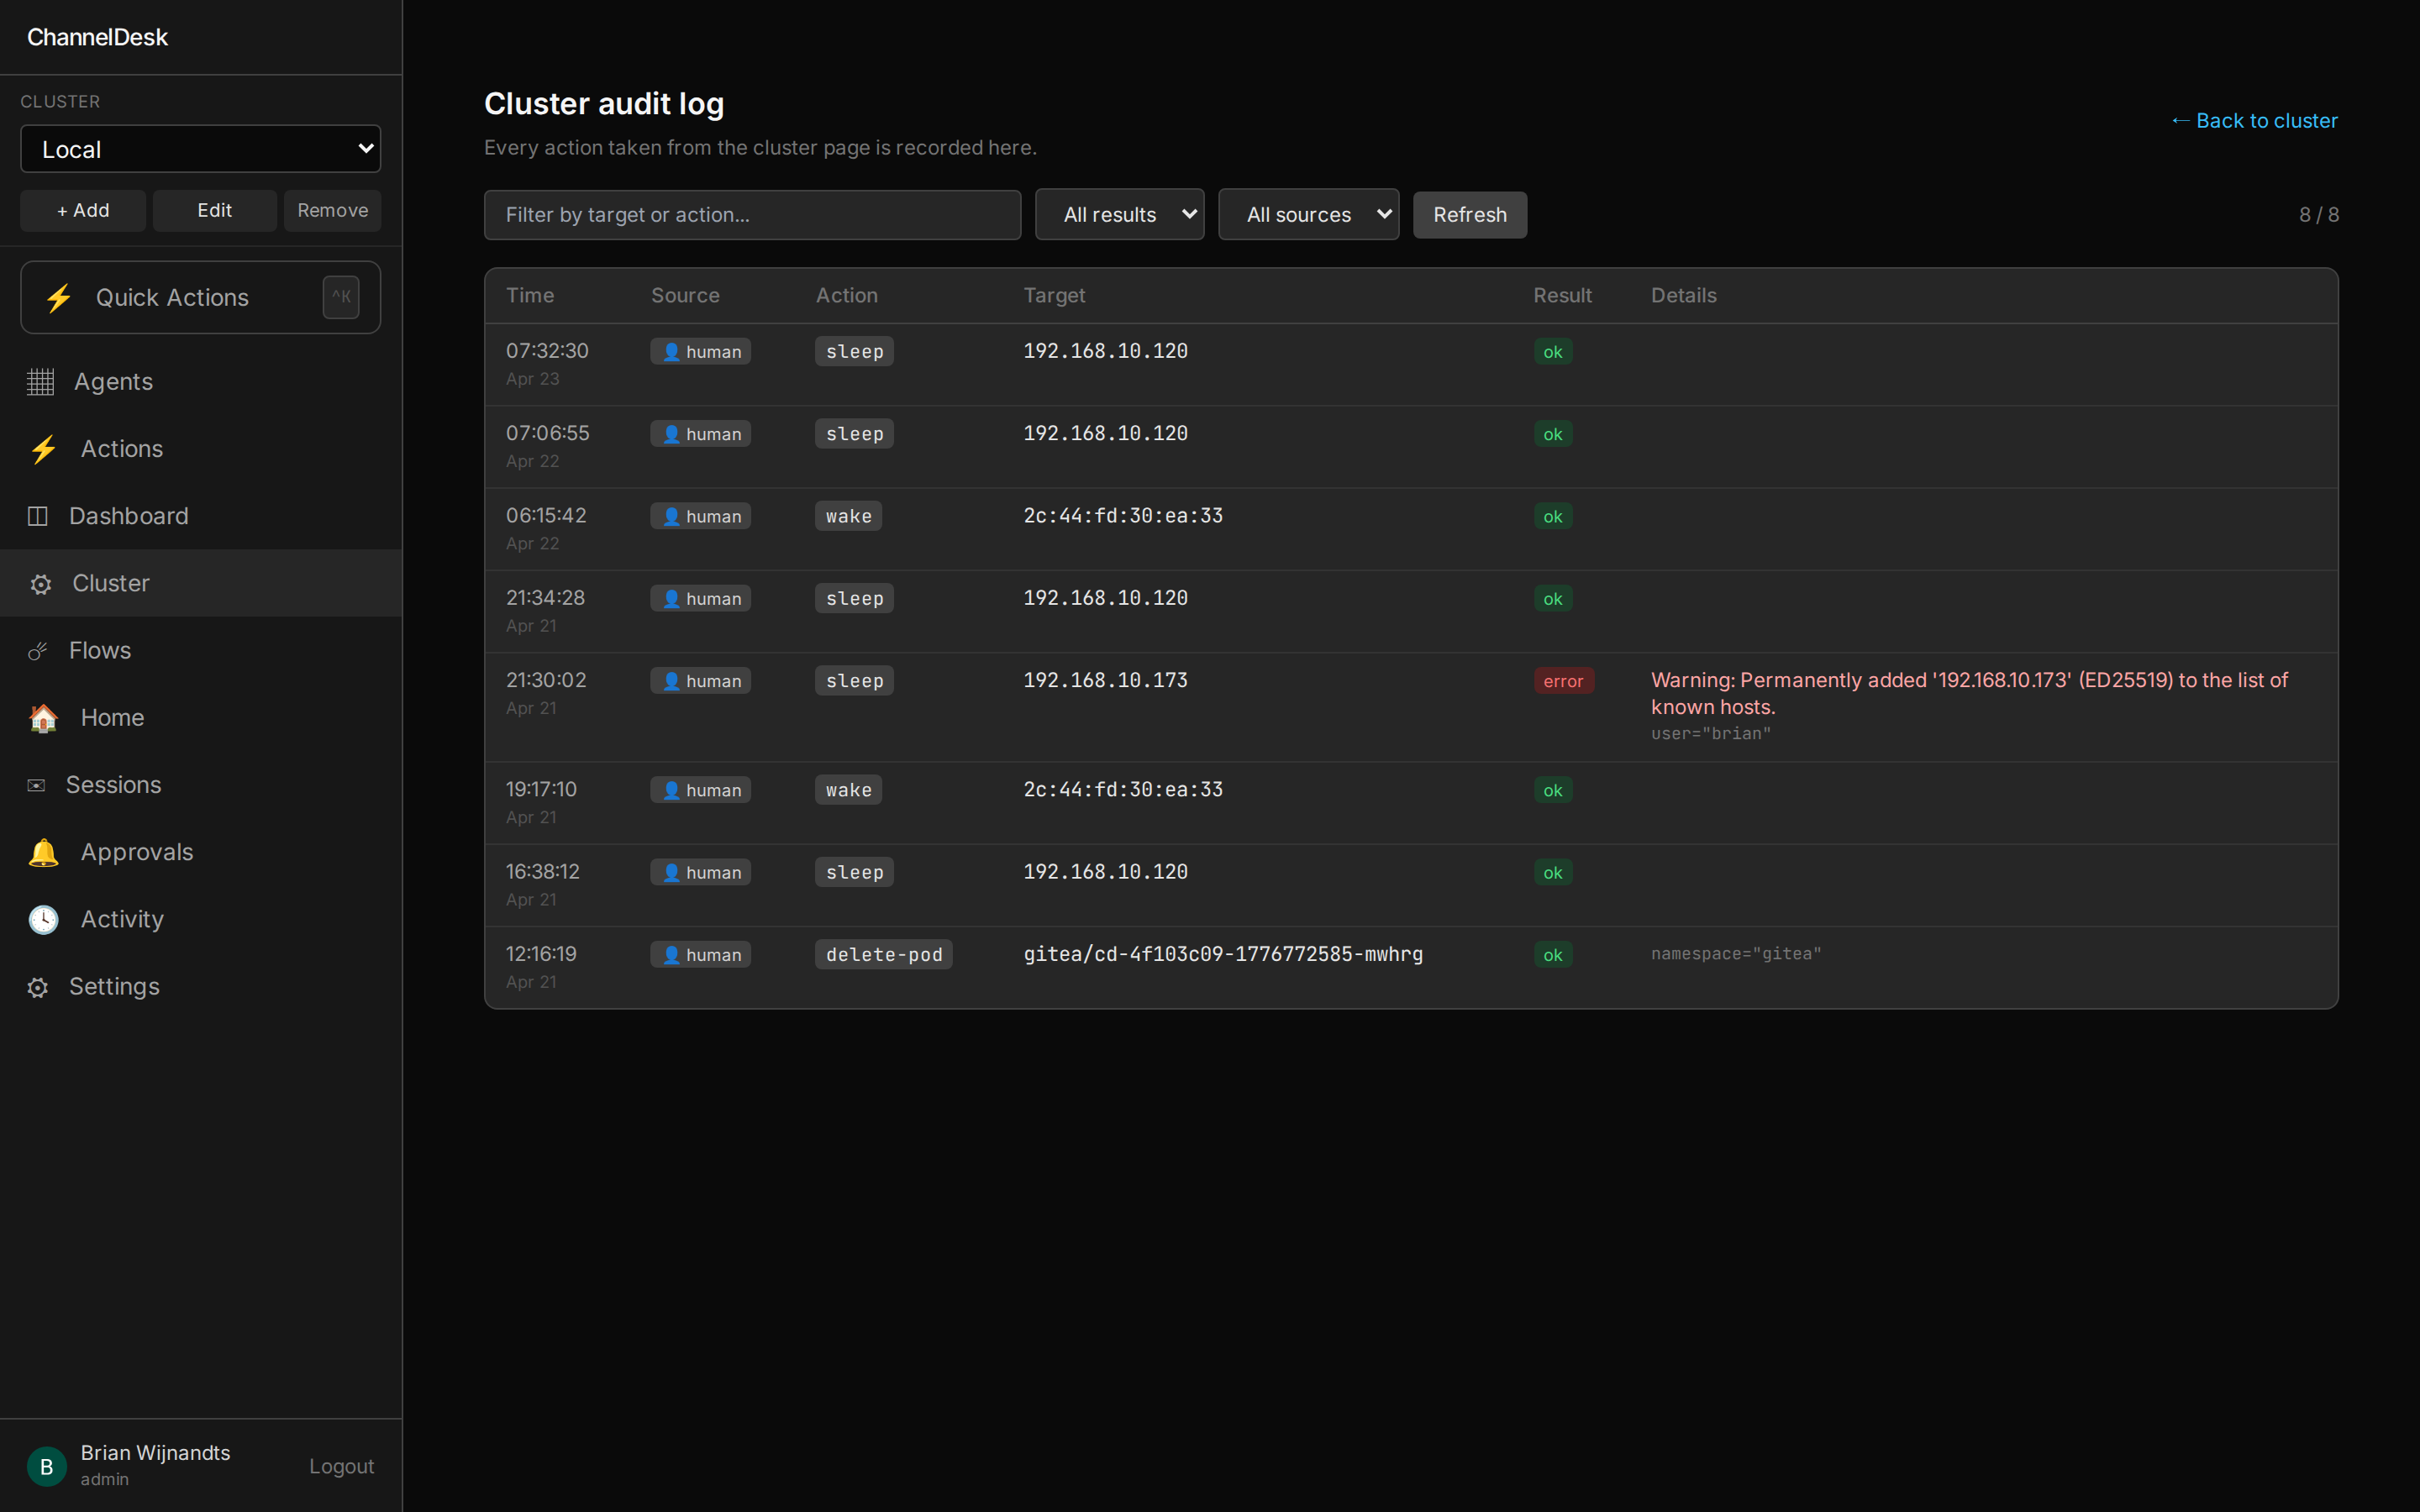
Every write tool sets X-Cluster-Source: agent so its audit row is
distinguishable from a human action. Every write requires explicit user Allow in the
chat — the agent cannot act unilaterally.
Approve from the kitchen.
The cluster page, the chat dock, Investigate, and the Allow / Deny prompt all ship as Progressive Web App. Add it to your iOS or Android home screen and the service worker keeps the shell warm. A pod goes red on Sunday morning and you triage it with one thumb.
Stop reading dashboards. Talk to your cluster.
ChannelDesk's cluster page is one click from a focused Claude session that already knows what's broken — and one Allow away from fixing it.